Compressor performance curves can provide a service technician with the Btu pumping rate (capacity), mass flow rates, operating amperage, and operating wattage of a compressor when the suction pressure and head pressure are known for the system. These curves are available from compressor manufacturers for each of their compressors. This type of data in table form is accurate and easy for the service technician to read and understand.
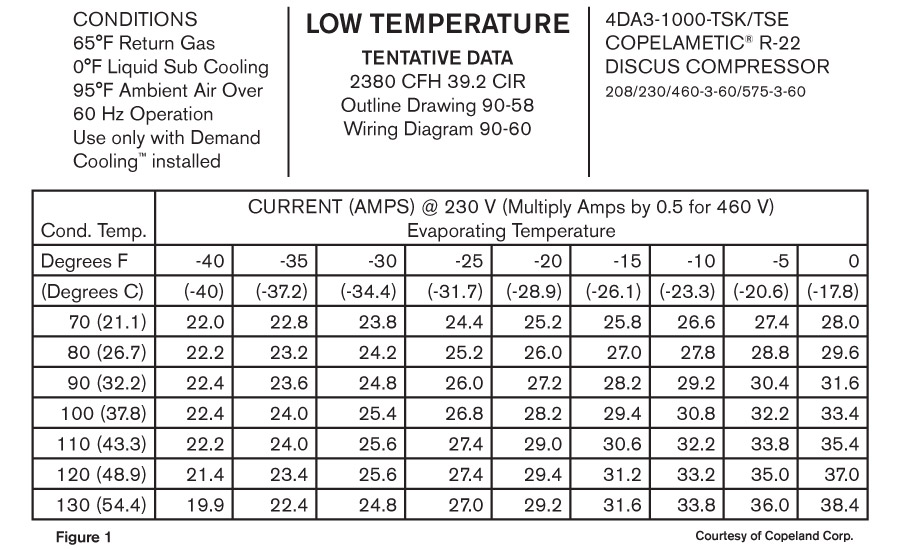
Figure 1 shows the amperage data for a 10 horsepower (hp), semi-hermetic, low-temperature Discus model using R-22 as the refrigerant. The upper-left corner of Figure 1 gives the rated conditions upon which the table is based. Although, for this article, we’re only looking at the data on current (amps) performance, a compressor performance curve can also provide capacity, power (watts), and evaporator mass flow rate data.
READING AMPERAGE DATA
Let’s try a sample question. Assume the compressor in Figure 1 is operating at 230 V and has an evaporator temperature of 0°F and a condensing temperature of 90°. Using Figure 1, determine the correct current (amp) draw for this compressor.
Note: The condensing temperatures are to the far left and are read in the vertical column of the current (amp) table. The evaporator temperatures are on the upper row on top of the current (amp) table.
Solution: The intersection of the 90° condensing temperature with a 0° evaporating temperature results in an amp draw of 31.6 A. The data tells us that this compressor, operating under these pressures, should draw 31.6 A at 230 V. If the compressor is operating at 460 V, the amperage values in the table would have to be multiplied by one-half.
If a service technician measures the compressor amps with an ammeter at the compressor and finds the amps to be very close to the table’s 31.6 A, he or she has a pretty good idea the compressor is up to specifications. If, however, the technician measures the current draw of the compressor and finds that it is pulling only 24 A at these same conditions, there is a problem somewhere.
A compressor pulling low amperage may be caused by:
• Bad suction and/or discharge valve;
• Starved evaporator;
• Worn rings;
• Leaking head gasket or valve plate gasket;
• Restricted liquid line or filter drier;
• Undercharged system;
• Weak motor; or
• Metering device starving evaporator.
The service technician must now systematically check each of the above causes and find the one that is the cause for the low compressor amp draw.
Notice in Figure 1 that, as the condensing temperature decreases, so do the amps. This is assuming a constant evaporating temperature. Also, as the evaporating temperature decreases, so do the amps. This is assuming a constant condensing pressure. Decreased condensing temperatures mean lower condensing pressures. The compressor’s piston now operates with less pressure against it as it compresses the suction gases. This, in turn, creates less stress on the motor and less amperage draws. As the evaporating temperature decreases, so does the evaporating pressures. These lower pressures entering the compressor’s cylinders mean less dense vapors filling the cylinders. Less mass flow rate of refrigerant vapor is pumped by the compressor, which causes the decreased amp draw.
Be aware that operating conditions other than just evaporating and condensing temperatures (pressures) are used for these tables. The conditions in the upper left of the table in Figure 1 are called nominal conditions and must be met for the values to be 100 percent accurate.
These nominal conditions are:
• 65° return gas temperature;
• 0° liquid subcooling;
• 95° ambient air over the condenser; and
• 60-Hz operation.
If these conditions do not exist, the table will not be 100 percent accurate. However, for purposes of systematic field troubleshooting, these inaccuracies are not great enough to have any significant effect on a good service technician’s judgment.
Publication date: 2/1/2016
Want more HVAC industry news and information? Join The NEWS on Facebook, Twitter, and LinkedIn today!


