In college, I met a group of guys that loved to meet on a field, carry an odd-shaped ball around, and run into each other with no equipment. They called this high-intensity game rugby.
One day, they asked me if I was interested in playing. It looked simple enough and fun, so I said sure. Once we started playing, I quickly realized that while I had the physical tools needed to be proficient in this game, I didn’t understand the rules or language of rugby.
I had no idea what a lineout was. I didn’t understand why hands couldn’t be used in a ruck. Every time they yelled “SCRUM!” it took me a few seconds to realize what was coming next.
I was rugby illiterate, and it was holding me back.
It’s easy to have a similar feeling of confusion and bewilderment come over you when it comes to data and analytics. The goal of this piece is to arm you with the basic terminology needed to be data literate and unleash your analytical potential.
WHAT IS DATA LITERACY?
Data literacy means you know what data you’re tracking, why you’re tracking it, how to interpret it, and how to use it to develop new capabilities, grow sales, reduce costs, and/or do your job better/more efficiently.
Data literate people have the following skills:
- Think critically about the data analysis process and the information and insights it delivers;
- Understand various data analytic methods and tools and know how to use them;
- Know what data is appropriate to use in specific situations;
- Understand the data being looked at;
- Recognize when data is being misrepresented;
- Create and interpret basic data visualizations (charts, graphs, maps, etc.); and
- Communicate information and insights to a broader audience (executives, managers, peers, external parties, etc.). This process is also called data storytelling.
In today’s tech-centric, data-driven world, it is easy to see why being competent and comfortable with data is an essential skill.
IT ALL STARTS WITH A CORNERSTONE
Understanding the language of data is an essential foundational pillar for anyone looking to develop data literacy.
This overview is intended for what I call “casual data consumers.” These are professionals who don’t deal with advanced data and analytics projects on a regular basis. We are looking to establish a baseline level of knowledge and confidence to become more data fluent.
You don’t need to know advanced statistical, data engineering, or modeling techniques to make this happen. Consider the words of Brent Dykes, author of “Web Analytics Action Hero: Using Analysis to Gain Insight and Optimize Your Business” — “Just like people don’t need an advanced English degree to be literate, your employees don’t need advanced statistical knowledge and programming skills in Python or R to be data literate. Reading and writing skill levels are often defined by what people can or can’t accomplish in their everyday life — we must do the same for data literacy.”
DO YOU NEED TO BE DATA LITERATE?
Yes, you do. You don’t need to know the intricate minutiae, but you need to know the basics.
Here’s an example: You may not be an accountant, but that shouldn’t prevent you from understanding the fundamental financial concepts of revenues and costs. Additionally, while you might not be creating financial statements, you need to understand how they work.
In the same way, while you might not be creating the databases, web platforms, data connectors, etc., that provide the data you use for decision-making, you need to have a fundamental level of knowledge on how these things work and the data they provide. That understanding will help you do your job better.
WHAT IS DATA?
Data is all around us, and we use it every day. It is a collection of facts, such as numbers, observations, words, or descriptions of things. In short, it is a value assigned to a thing.
Consider that you have a name, height, weight, age/date of birth, social security number, nationality, income level, shoe size, etc. All of these things are different types of data about you.
There are two primary types of data: quantitative and qualitative.
Quantitative Data — These are values and/or counts that can be measured objectively. These are always numerical. In the business world, this can be sales data, profits, or costs. In the non-business world, this can be things like weight, temperature, length, width, height, or volume. When you think quantitative data, think “How much or how many?”
There are two types of quantitative data: discrete and continuous.
- Discrete — This is data that has a finite level of detail and is typically an integer. A great example is counting people. You can’t count two and a half people; there are two or three people, with no in between.
- Continuous — this is data that can be cut to various levels of detail. Time is an excellent example. You can measure time in centuries, years, months, days, weeks, etc. Time is continuous, because we can measure it at progressively more precise scales.
In general, if you are counting something, then it is discrete. Measurements will be continuous.
Qualitative Data — These are nonnumerical groupings that are created when you classify or categorize something. These groupings represent different “cuts” that can be made to the data.
In business, this could be sales region, channel, product line, or brand. In the nonbusiness world, it could be colors, shapes, textures, smells, opinions. When you think qualitative data, think “What kind, or how is it?”
There are three types of qualitative data: nominal, ordinal, and binary.
- Nominal — Categorical data that falls into unordered categories. Examples include hair color, race, and smoking status. There is no natural order or ranking to these values.
- Ordinal — Categorical data that falls into naturally ordered categories. Examples include education level (grade school to Ph.D.), satisfaction (bad to great), or pepper hotness (mild to scalding hot).
- Binary — A type of categorical data in which there are only two categories. Binary data can be either nominal or ordinal. Examples include right/wrong, up/down, yes/no, or on/off.
So, let’s put that all together: If a company wanted to know their sales by product shape and region, they would segment their quantitative measurements (sales) by qualitative dimensions (product shape and region).
DIFFERENT DATA TYPES
There are also differences in the types of data you can use.
Primary Data — Data collected directly, usually as a result of doing business. Examples include sales data, purchasing data, customer lists, or employee lists.
Secondary Data — Data you or your organization gets from another source. Any government data used by businesses, such as data from the Census Bureau, would be secondary data. Other examples include purchased marketing lists, custom surveys, or market research reports.
Structured Data — Clean, organized data that can easily be understood by a computer (also called machine-readable). Think of data that can be easily accessed by a spreadsheet or database. Structured data can be used in many different ways, can be searched and versioned easily, and is readily transferrable between systems.
Unstructured Data — A lot of our correspondence occurs in an unstructured format. Think of email, , text, video, etc. While it is easy for a human to process and understand this type of information, a computer struggles because the data has no fixed underlying structure. As such, it does not know how to process the information. This can also be called non-machine-readable data.
Here are a few examples:
Email Message 1: Matt called and said the sales meeting with customer XYZ needs to be moved to 3 p.m. on Thursday, Aug, 30, 2019.
Email Message 2: James has confirmed the proof of concept call with customer ABC on Monday at noon Eastern Time.
Email Message 3: The Tuesday, 2 p.m. meeting on Mar. 14, 2019, with customer DEF has been canceled, per John.
STATISTICAL ANALYSIS
Another major part of data science is statistical analysis. Data is collected, and statistics are applied to extract insights from the data. There are two primary ways to collect data for things like surveys and market research.
Census — An official count or survey of a population that typically records various details of individuals. The goal is to count every single member of a population. An example would be the U.S. population census conducted by the Census Bureau every 10 years. This is a excellent method of collecting high-quality data, but is very laborious, time consuming, and expensive.
Sample — Counting an entire population might not be feasible, in which case a subset of manageable size will be selected. The best way to avoid bias in the sample population is to do a random selection. Statistics are calculated from the samples, and extrapolations are made from the sample to the population.
There are also different types of statistics:
- Mean — Also called “average.” Use this if your data has a symmetrical and continuous distribution;
- Median — The midpoint of all values, or the middle number. The median of 4, 7, 8, 9, and 1,000 is 8. Use this if your data has major outliers;
- Mode — The most common number in a dataset. For example, 2, 4, 5, 5, 5, 6, 6, and 8 has a mode of 5; and
- Weighted Average (a type of mean) — Each value in a dataset is given a weight based on its importance. For example, Item 123 has a revenue of $5,000 at a sell price of $50 (100 pieces) with customer ABC, while customer DEF has a revenue of $10,000 with a sell price of $25 (400 pieces). The weighted average sell price is $15,000/500 pieces = $30.
ADDRESSING COGNITIVE BIASES
Cognitive biases are lapses in logical and rational thinking, remembering, or other cognitive processes. These often occur as a result of maintaining one’s beliefs and preferences even when practical, logical, and/or contrary information is present.
Biases can be grouped into four main categories: too much information, not enough meaning, the need to act quickly, and the limits of memory.
Figure 1 represents a grouping of the different types of biases.
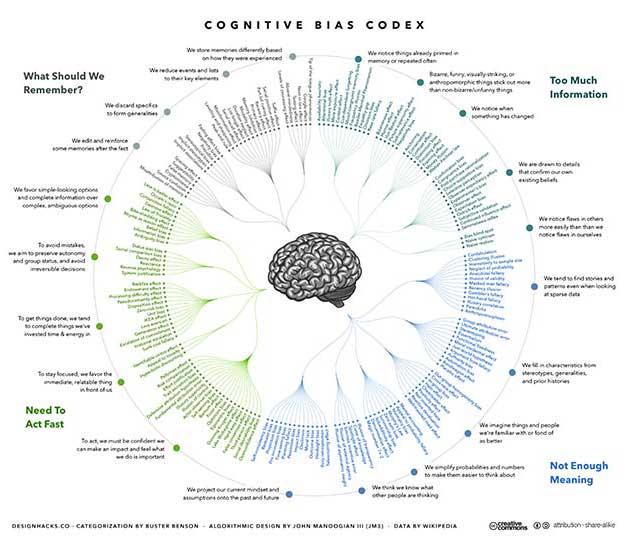
Click the graphic to view / download an enlargeable PDF version.
FIGURE 1: A visual representation of the different types of cognitive biases. Biases can be grouped into four main categories: too much information, not enough meaning, the need to act quickly, and the limits of memory.
Everybody has cognitive biases. But, despite their reputation, not all biases are negative. Many of them serve an adaptive purpose and are actually essential to speed up decision-making.
While it is impossible to remove all biases (it’s part of being human), it is critical that we put effort toward identifying and acknowledging potentially misleading prejudices so that we can conduct objective analysis. Below are the most common biases in the data and analytics world.
- Availability bias — The availability bias refers to the way in which people make decisions based only on information readily available to them.
- Selection bias — A propensity to select data for analysis that is not random.
- Sponsorship bias — The tendency to support the interests of a business or financial sponsor.
- Observation bias — Seeing what we want (or expect) to see in results.
- Confirmation bias — The tendency to look for relationships and results that confirm preconceived beliefs.
- Anchoring bias — Valuing the first piece of information you receive too much. A great example is learning the average price of an item is $100. You might think any other price you find below $100 is a value purchase, even though your anchor point of $100 was far too high. Your perception of value is skewed by the first number you saw.
Remember that it is healthy and useful to stress test your viewpoint with different perspectives.
OTHER IMPORTANT TERMS
Data Visualization — The graphical representation of information and data. This is one of the best tools in the tool belt of a business professional to help communicate information and insights clearly and efficiently to a wide audience. A good visualization is an excellent way to see and understand trends, outliers, and patterns in data that might otherwise go unnoticed.
Correlation — A statistical term that reflects the relationship between two data sets. For example, there will be a strong positive correlation between how hot it is and the number of air conditioners turned on.
Important Note: Correlation does not always mean causation. There can be other factors that cause two data sets to be strongly related.
Aggregation — The process of summarizing or “rolling up” data to a higher level to facilitate analysis. An example would be having population count data by city and then aggregating the data to the state level to get a state population count.
ETL (extract, transform, and load) — The process of moving data from one place to another. An example would be moving data from a database to a spreadsheet for analysis.
Geocoding — The process of assigning a latitude and longitude to a location so the data can be mapped.
Mapping (geospatial analysis) — There are tremendous insights gained from viewing data on a map. Geospatial analysis applies analytical techniques to data which has a geographical or spatial aspect.
KEEP LEARNING
Hopefully this piece has highlighted why data literacy is so important and will help you start to develop your data skills.
If you want to get good at anything, you need to practice, so be sure to look for opportunities to flex these new data muscles.
Publication date: 12/24/2018
Want more HVAC industry news and information? Join The NEWS on Facebook, Twitter, and LinkedIn today!