In 2018, Wiss, Janney, Elstner Associates, Inc. (WJE), a global engineering and architecture firm, constructed a new laboratory facility and installed an HVAC system that operated 24/7. The laboratory covers an area of thirty-five thousand square feet and features thirty-seven individually controlled HVAC zones, which include both critical and non-critical lab spaces. The critical lab spaces are designed to maintain precise temperature and humidity conditions for specific testing requirements, as well as ventilation for life safety. The most stringent requirements include two labs that require around-the-clock conditions of 73°F ± 4°F and 50% ± 3% relative humidity which is essential for performing certain tests. Other laboratories at the site require on-demand ventilation for safety reasons.
The WJE Northbrook Facilities team investigated potential energy savings with a focus on sustainability. Collaborating with key laboratory personnel, they explored the feasibility of reducing temperatures in non-critical general and open lab spaces including storage areas during nights and weekends. This collaborative effort identified sixteen individual temperature zones that could be safely adjusted during off-hours without affecting critical operations.
HVAC Unit Complexity
Two major HVAC rooftop units (RTU) manage the air supply for the identified sixteen non-critical lab spaces. These units leverage modern technology, including outdoor air dampers, also known as economizers, to regulate the intake of fresh air based on several real-time parameters such as outdoor air temperature (OAT), outside humidity, and building return air temperature. Advanced monitoring also includes levels of carbon dioxide, total volatile organic compounds, and particulate matter (PM2.5 and PM10). While typical office building RTU economizers bring in at least 10% outside air (OA), the WJE units are configured to meet higher standards due to the potentially hazardous nature of the lab environments—one unit is set to a minimum of 30% OA, and the other brings in 100%. This significant intake of outside air presented WJE with a substantial opportunity for energy savings by reducing the demand during off-hours.
Local Utility Energy Efficiency Incentive
As active members of the International Facilities Managers Association (IFMA), the facilities team was made aware of a no-cost facility assessment offered by the local electric utility, which could reveal available energy-saving incentives. During the utility’s assessment in July 2022, we inquired about reducing laboratory occupancy for non-critical labs and were informed that an incentive was available. However, this type of incentive was beyond the scope of the assessment team, who explained that they identify standard incentives using predefined equations for calculating electricity reductions, such as those for LED lighting upgrades.
Due to the complexity of the laboratory HVAC system, calculating the potential kilowatt-hour (kWh) savings before implementation was a challenging task. Utilizing an ASHRAE 62.1- based simplified calculation method, data was downloaded from the building automation system, the energy savings were estimated, implementation quotes were obtained, and a custom incentive application was submitted to the utility in September 2022.
Savings Calculations
Although termed 'simplified,' the ASHRAE methodology for calculating energy savings demands extensive knowledge of the building's HVAC system. Accurate calculations hinge on real-time OAT and humidity, which significantly influence the building's heating and cooling demands. Instead of relying on standard weather data, such as that from the local weather station at O’Hare Airport, we utilized three years of detailed building data recorded every 15 minutes by the Building Automation System. This precise data enabled the calculation of sensible and latent energy needs throughout various times, particularly during nighttime hours.
The energy calculations consider factors like OAT and humidity, damper positions of the OA, airflow reductions, and temperature setbacks for each HVAC unit. These values are initially computed in British Thermal Units (BTU) and subsequently converted into kWh for cooling (3,412 BTU per kWh) and therms for heating (100,000 BTU per therm). After running multiple scenarios, the estimated annual savings were calculated at 120,210 kWh of electricity and 7,655 therms of natural gas. These savings are equivalent to the annual energy consumption of eleven average U.S. households for electricity and five for natural gas, according to data from the Energy Information Administration (https://www.eia.gov/).
Substantial Electricity Reduction Achieved
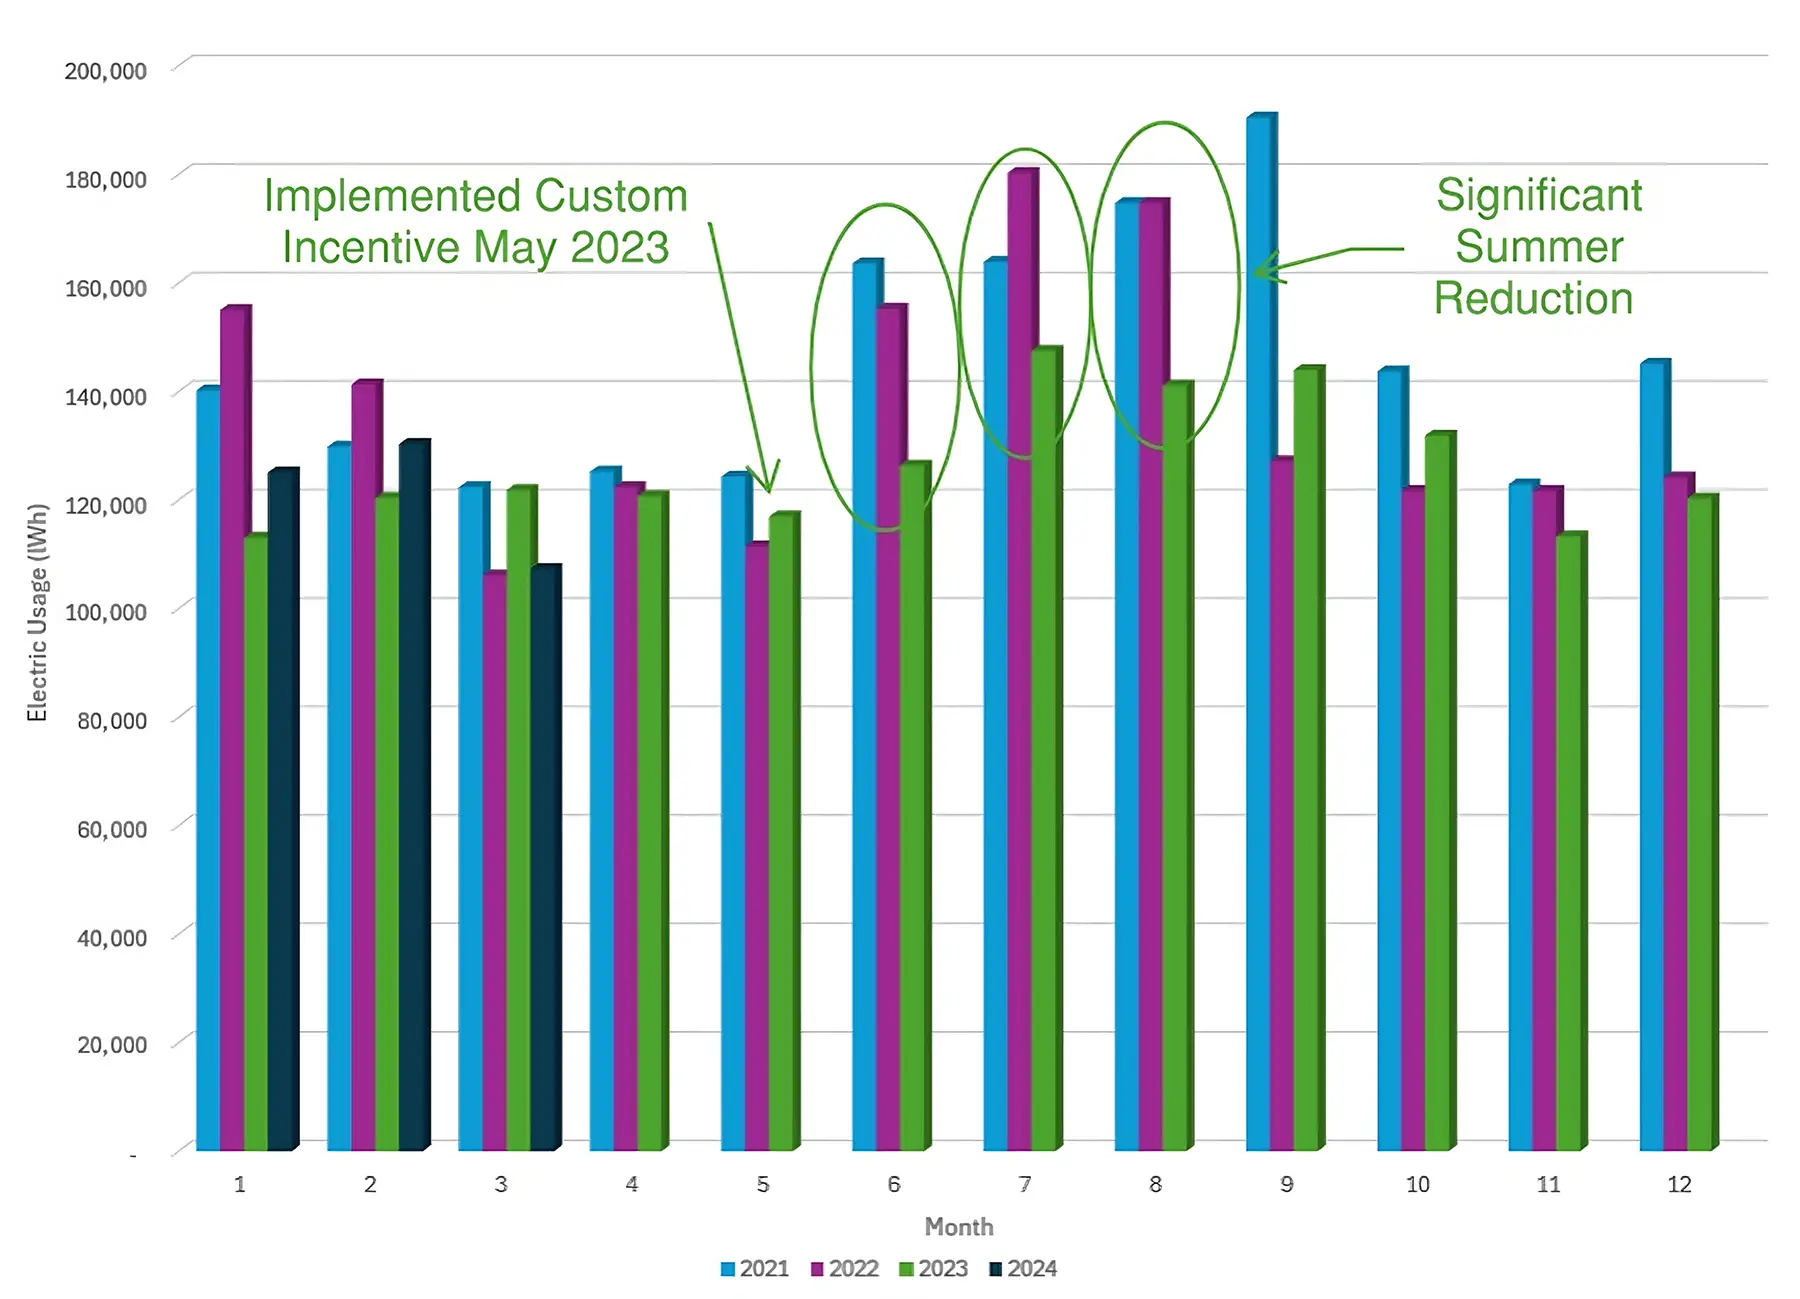
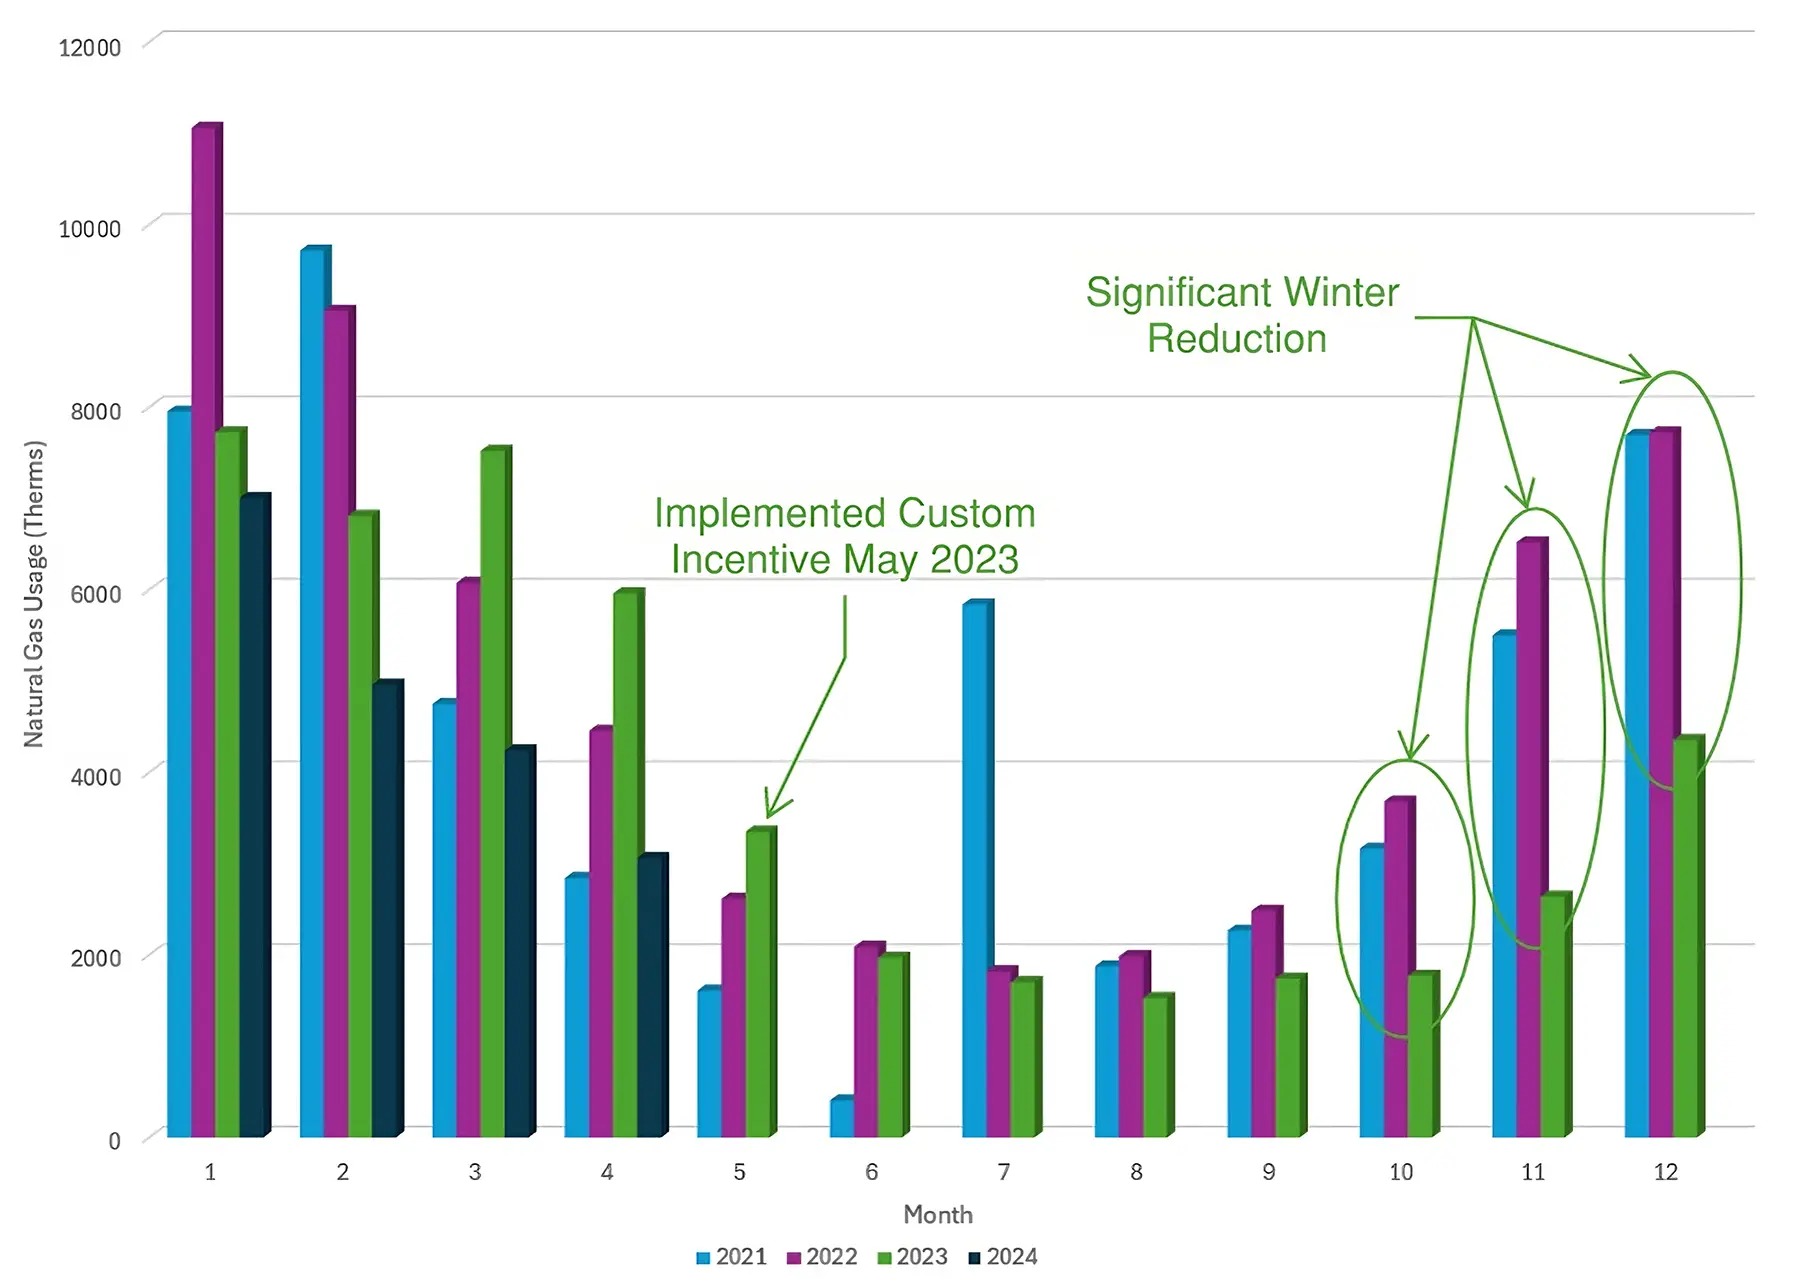
Application approval for the temperature setback project at WJE was granted in April 2023. One year after completion, the building achieved significant energy reductions, saving a total of 131,850 kWh in electricity and 12,541 therms in natural gas. The total upfront project cost was $17,458, and the local utility covered $15,650 through the incentive program, leaving WJE with an out-of-pocket expense of merely $1,808. These adjustments have resulted in annual energy savings of approximately $24,000. The accompanying graphs demonstrate the building's electricity and gas usage over the past four years, highlighting the most significant electric savings during the summer months, due to cooling, and the greatest gas savings in the winter months. Importantly, these changes did not affect operations within the laboratories and were not even noticed by laboratory staff.

Click graph to enlarge
ELECTRICAL USAGE: Note: The electricity usage decrease in January (1) 2023 is the result of a 17-day laboratory HVAC unit shutdown. (Courtesy of Wiss, Janney, Elstner Associates)

Click graph to enlarge
GAS USAGE: Note: The spike in July (7) of 2021 is a result of the utility company estimating the buildings natural gas usage during the month. The utility company installed smart meters in 2022 and discontinued meter estimations. (Courtesy of Wiss, Janney, Elstner Associates)
According to the custom incentives impact evaluation report prepared by the utility, there were 16 similar HVAC-controls incentives issued in 2021 which resulted in a total annual reduction of 198,210 kWh averaging roughly 12,000 kWh each. This project stands out significantly, with its substantial electricity reduction distinguishing it from similar projects performed the year prior. Given that the local utility provider serves over four million customers in the Chicagoland area, the impact of this project not only demonstrates its uniqueness but also highlights the effectiveness of the local utility incentive programs in achieving large-scale energy savings.


